 Heat
Heat
 Rain
Rain
WeatherShift™ Heat
fTMY (Future TMY/EPW) Data and fDD (Future ASHRAE Design Day) Data
| Data Type | First Scenario | Each Additional Scenario |
|---|---|---|
| fTMY | $285 | $200 |
| fDD | $285 | $200 |
Buildings and infrastructure built today will experience significantly different weather patterns over the course of the 21st century due to the impact of climate change.
The WeatherShift™ Heat uses data from CMIP6 global climate change modeling to produce EPW weather files and Design Day files adjusted for changing climate conditions. (EPW files contain hourly values of key weather variables for a typical year and are intended to be used for simulating building energy requirements.) The projected data can be viewed for multiple future time periods based on the emission scenario selected.
This site is preloaded with some EPW files provided to the public domain by the US Department of Energy. For all other shift locations -- indicated by an -- an EPW or Design Day file must be uploaded as the basis for shifting.
Click on a marker to view the free pre-analyzed data in the graph below.
Average Monthly Data
Projected changes in typical weather conditions can be reviewed month-by-month for a number of weather variables.
GHG Concentration Scenarios
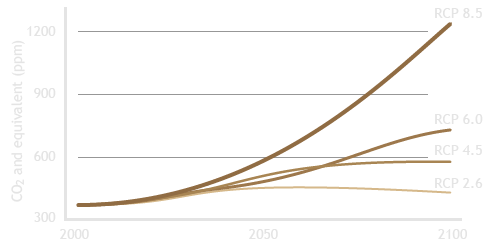
The RCPs (Representative Concentration Pathways) are greenhouse gas emission scenarios for the 21st century that result in the CO2 equivalent atmospheric concentrations shown in the graph. The designation for each scenario corresponds to the additional radiative forcing in 2100 compared to preindustrial conditions for that scenario. For RCP 4.5, for example, that would be an additional 4.5 W/m2 of heating in 2100. The scenarios were created by the Intergovernmental Panel on Climate Change (IPCC) as a basis for the climate projections done for its Fifth Assessment (AR5).
The Weathershift tool adjusts weather files for the future climatic conditions based on RCP 4.5 (moderately aggressive mitigation) and RCP 8.5 (business as usual).
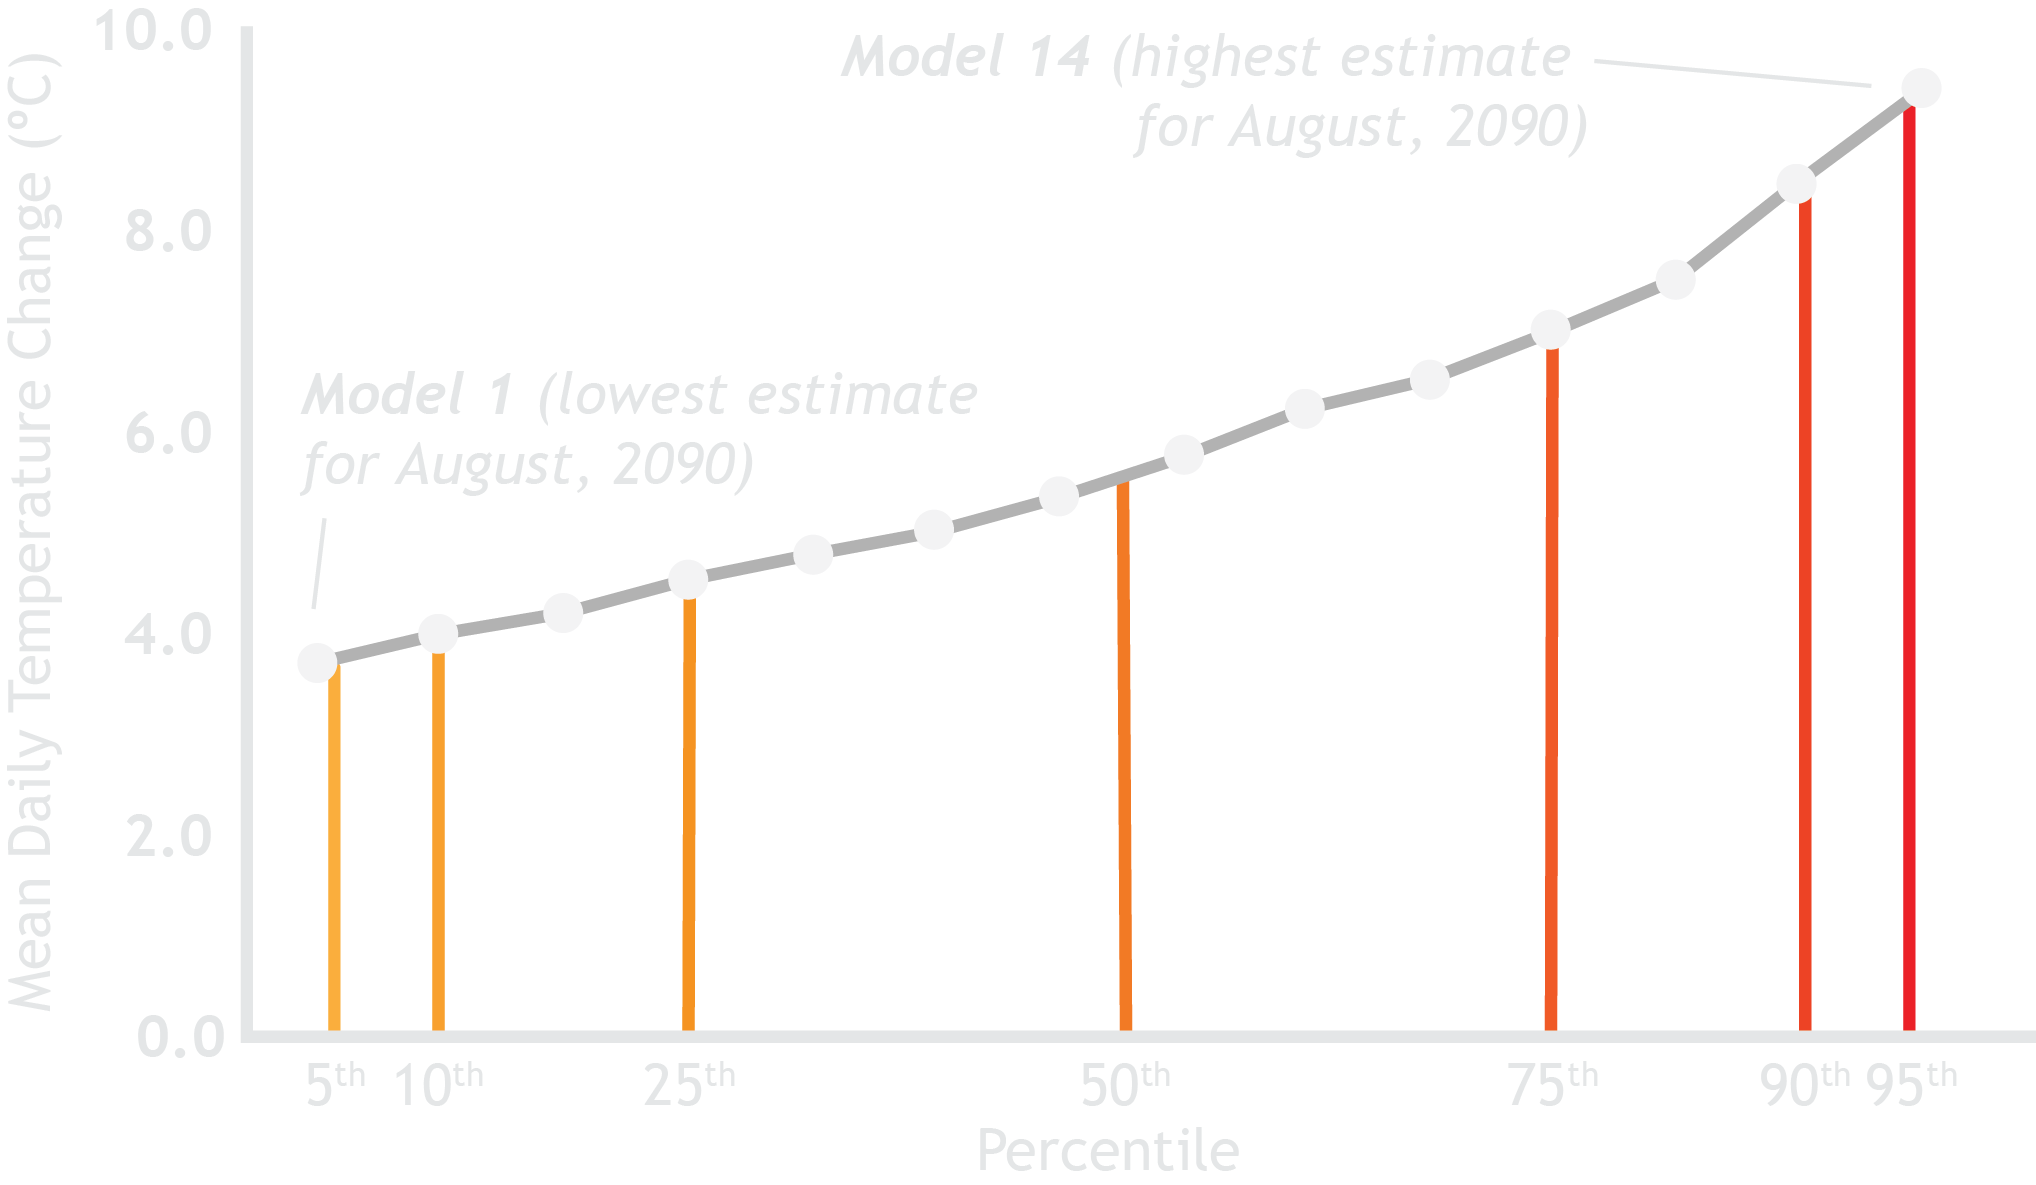
Sample City (August, 2090, RCP 8.5): 14 climate change models, ranked by projected temperature increase