
| Data Type | First Scenario | Each Additional Scenario |
|---|---|---|
| fIDF | $550 | $385 |
| fDTS | $550 | $385 |
WeatherShift™ Rain uses data from 21 CMIP5 global climate models (GCMs) to generate projected climate change-shifted rainfall Intensity-Duration-Frequency (IDF) curves and 27 GCMs to generate Daily Time Series (DTS) rainfall data for use in drainage infrastructure design, such as sizing storm drain networks, pump stations, treatment plants, and rainwater harvesting tanks.
WeatherShift Rain provides the opportunity for flexible and robust analysis by projecting rainfall intensity for multiple rainfall durations (3-, 6-, 12-, 24-, and 48-hours), two emission scenarios (RCP 4.5 and RCP 8.5), a range of possible climate outcomes (seven per emissions scenario) and in years 2035 and 2090. This data allows designers and engineers to plan and design measurable and cost-effective solutions to mitigate the effects of changing rainfall patterns.
Figure 1 shows the 5th, 50th, and 95th percentile IDF curves at the end of the century (2090) under RCP 8.5 for a 100-year return period compared to the corresponding existing 100-year IDF curve (based on historical rainfall data). Using projected IDF curves, investment costs can be balanced with an owner’s preferred levels of service (or risk mitigation) based on a quantitative assessment of future performance.
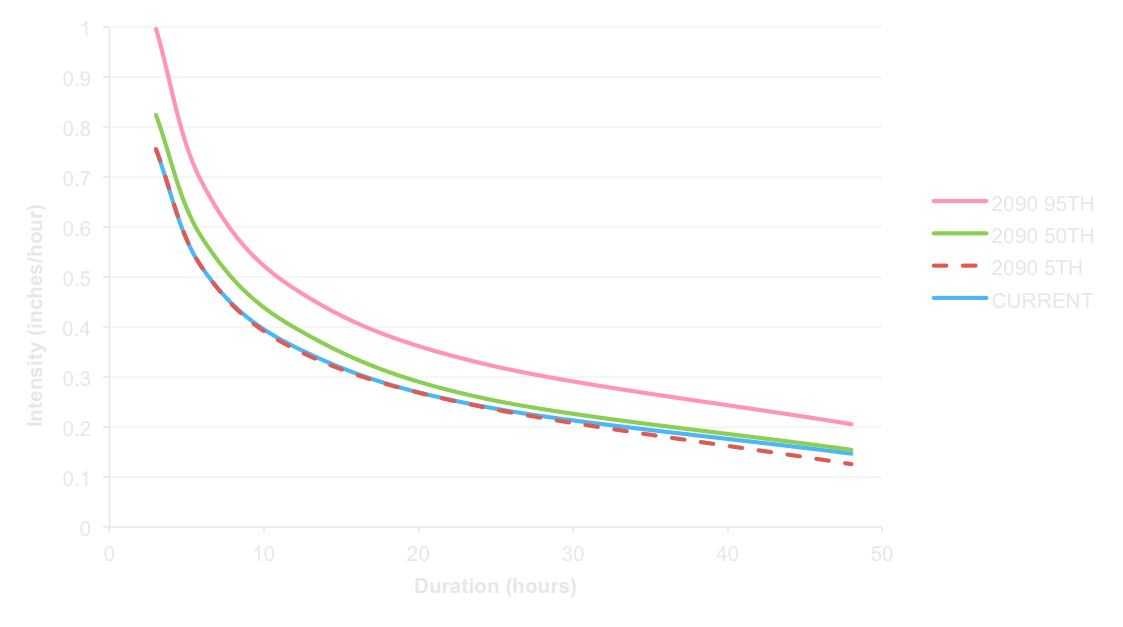
Figure 1
IDF Curves for San Francisco at the End of the Century under RCP 8.5
As an example, a drainage system is first designed using baseline historical rainfall data, then tested several times using a range of projected rainfall data to evaluate future performance. Alternative design options can then be studied to evaluate the costs of mitigating a range of risks that will emerge over time and guide decisions around the level of risk an owner is willing to accept with respect to changing rainfall patterns. Figure 2 illustrates these options through a stormwater pump station design tested under both RCP 4.5 and 8.5 for the lower, median, and upper tails (5th, 50th, and 95th percentiles) of the 21 global climate models, along with corresponding costs for mitigating future impacts. Using historical rainfall data, this project’s maximum pumping rate would be 500 gpm at a cost of $50,000, but is expected to be undersized in future. The owner may instead invest $65,000 or $85,000 now to mitigate either RCP-4.5-95th or RCP8.5-95th thus reducing the risk of capacity exceedance until Year 2090 (for that climate scenario).
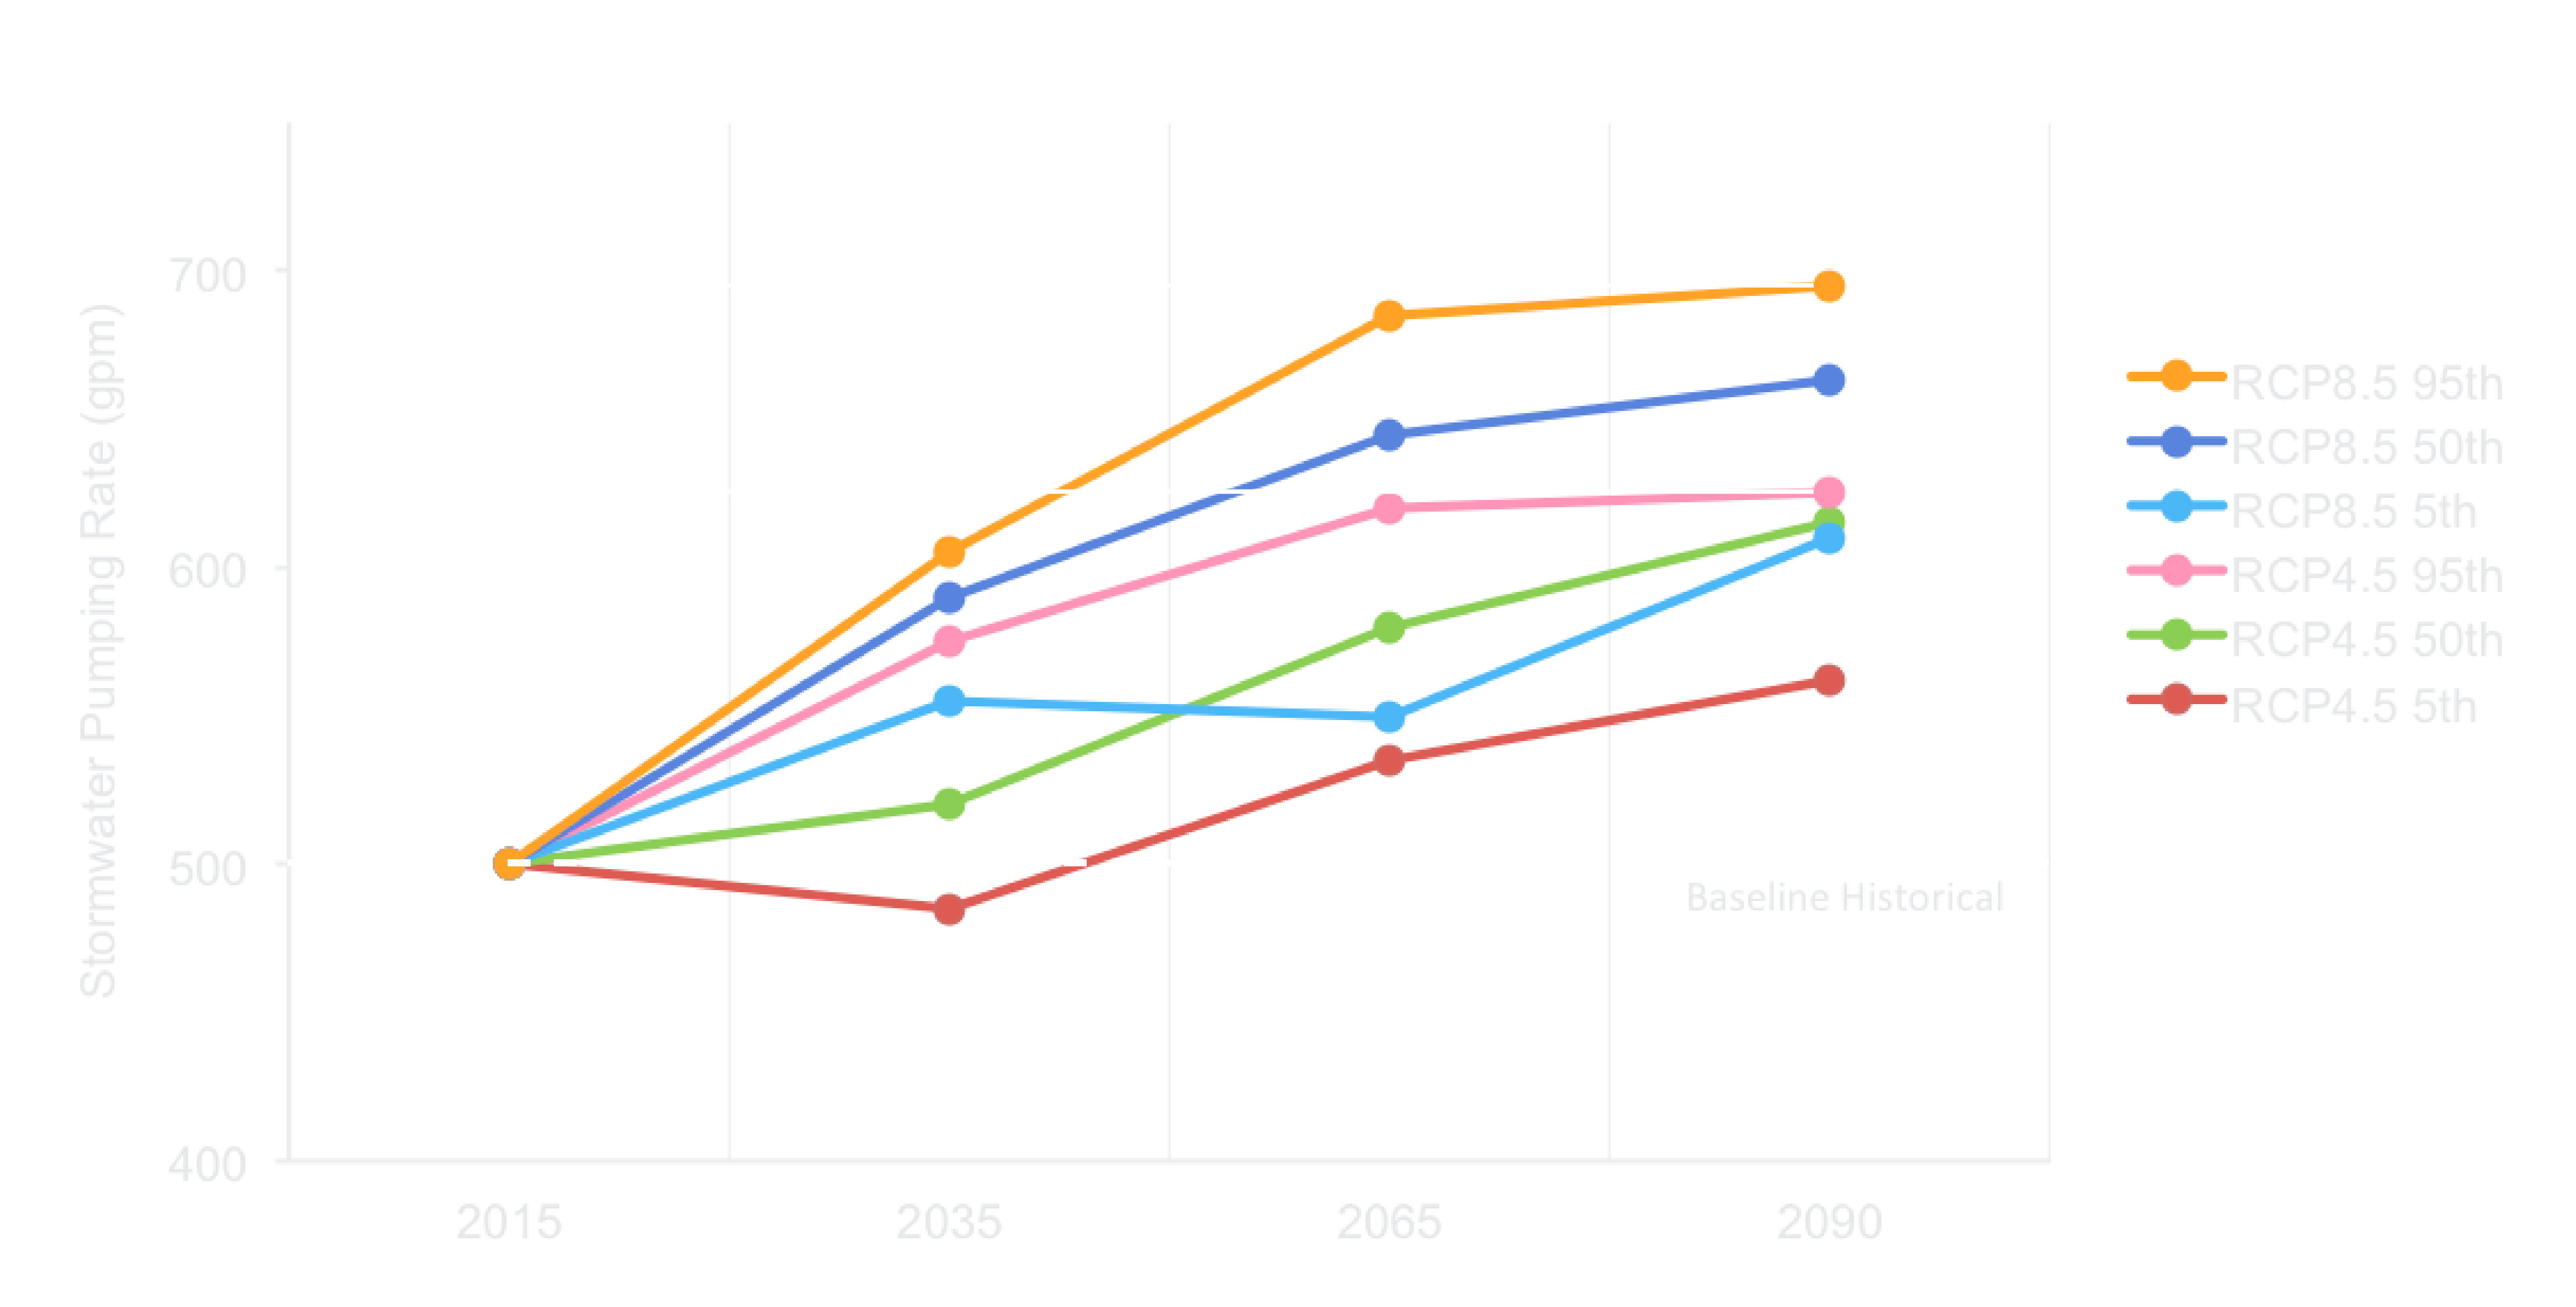
Figure 2
Capital Investment Costs vs. Risk Mitigations, Scenario Tradeoffs
TopUp is a GIS-based platform which evaluates and optimizes rainwater harvesting tank sizes based on daily rainfall time series data coupled with building and site demands for non-potable water reuse at a building or campus scale. The tool constructs a mass balance equation using rainfall time series data to determine the daily supply of rainfall runoff entering the tank, balanced with the demands (e.g., irrigation, toilet flushing, etc.) being withdrawn from the tank. The tool performs a regression analysis, testing several tank sizes over the daily time series and plotting the actual amount of rainwater used in a given year for each tank size tested.
By partnering TopUp with WeatherShift, tank sizes can be tested against climate change-shifted rainfall patterns in order to evaluate future performance. This offers the opportunity for an owner to select a tank size which best suits their objectives, such as cost effectiveness and/or adaptability.
Figure 3 studies the rainfall patterns under RCP 8.5 at mid-century (2056-2075) with historical rainfall as the baseline. The study shows that by mid-century under the 50th percentile (median rainfall shift), the balanced tank size (one that utilizes the most annual rainfall per gallon of tank storage) would be 5% larger than a tank sized using the baseline (historical) rainfall data. However, by testing the upper and lower tails (5th and 95th percentiles), the study shows that the balanced tank size at mid-century should actually be sized 5% smaller than the baseline.
The owner may then choose to install the smaller tank now, while leaving space in the site plan to expand the tank later to increase harvestable rainwater if the median rainfall shift occurs. Further, while both the upper and lower tails yield a similarly balanced tank size, the study shows a significant range in daily harvestable rainwater between the wettest and driest future scenarios. This information may be particularly important if the owner must meet a certain percentage of their irrigation demand with rainwater; thus if the drier rainfall shift occurs, then another rainwater source or a larger tank might be needed.
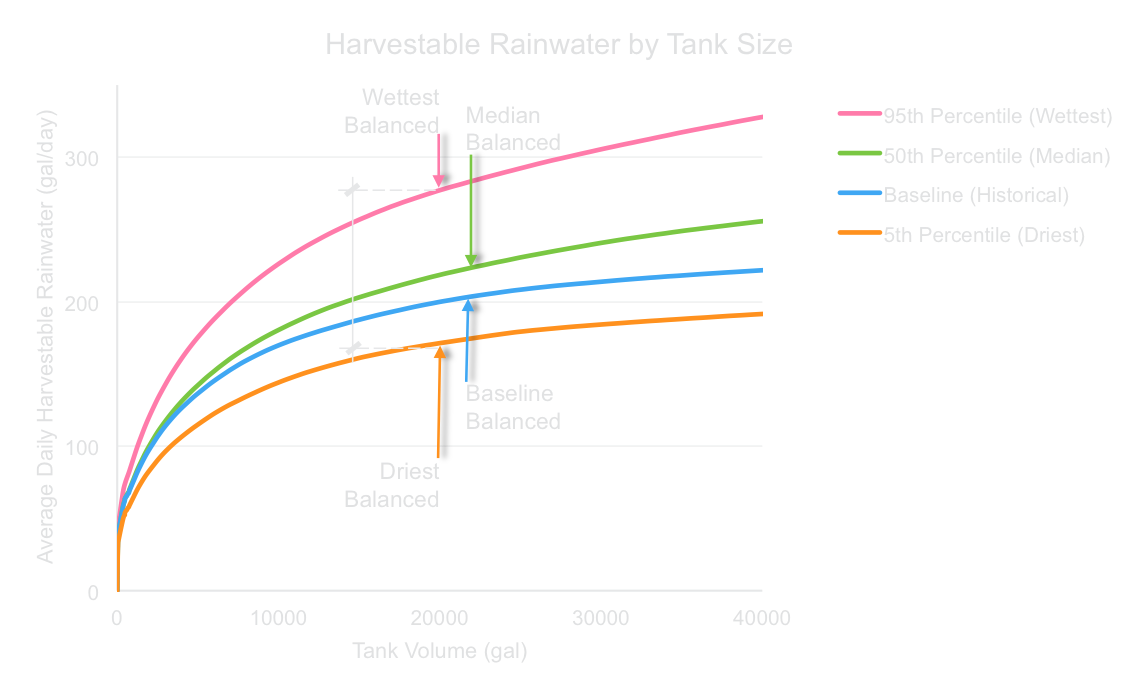
Figure 3
Harvestable Rainwater by Tank Size
By mid-century, the balanced tank size should be 5% smaller than the baseline balanced tank size and harvests between 160 gal/day and 185 gal/day.
Recommendation:
Construct smaller tank now and leave room to expand/ adapt at mid-century to optimize rainwater reuse if the median rainfall shift occurs.
 Heat
Heat
 Rain
Rain